
⚡ Built for very large trees
The tree is laid out and drawn on a canvas inside a Web Worker, so the main thread stays free. No DOM per node, ever — which is the one thing a chart made of elements cannot avoid.
Org chart
Draw a tree the way it wants to be read — tiered, indented, radial or as a wheel
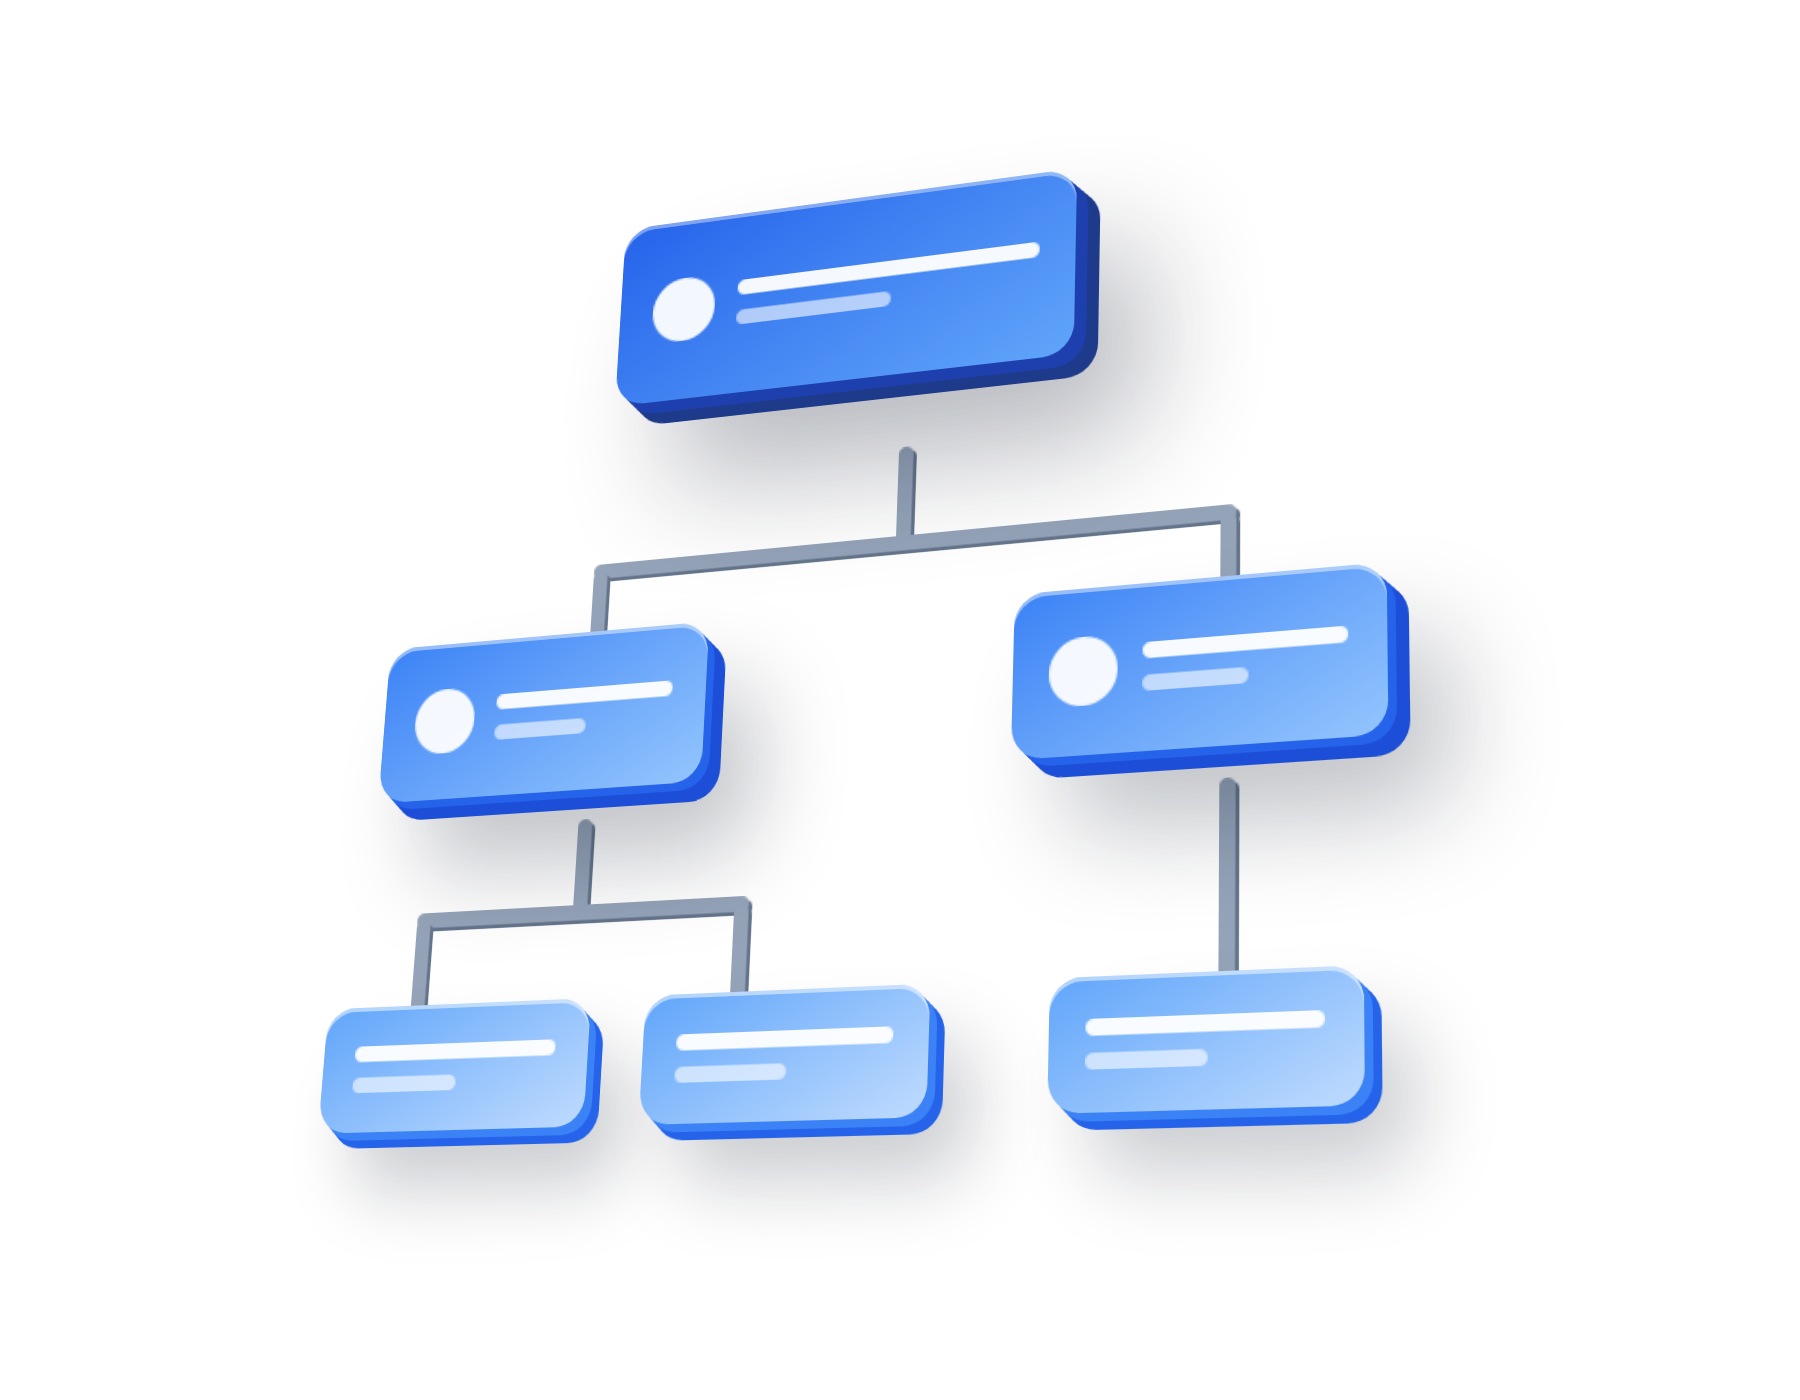
The tree is laid out and drawn on a canvas inside a Web Worker, so the main thread stays free. No DOM per node, ever — which is the one thing a chart made of elements cannot avoid.
Org chart
An org chart, a file explorer, a radial dendrogram, a wheel you can drill into. Change one option; the data stays exactly as it was.
Tree view
Product categories, menus and taxonomies straight from a parent_id table. Drag a category to a new parent, load subcategories on demand, filter to what matches.
Category tree
npm install @klad/coreimport { createKlad } from '@klad/core'
const chart = createKlad(document.getElementById('chart')!, {
data: [
{ id: 'ceo', name: 'Jamie Fox', title: 'CEO' },
{ id: 'cto', parentId: 'ceo', name: 'Amy Chen', title: 'CTO' },
{ id: 'cfo', parentId: 'ceo', name: 'Priya Rao', title: 'CFO' },
],
nodeSize: { w: 180, h: 64 },
label: (item) => String(item.name ?? ''),
})Pan, zoom, click, keyboard navigation. data is flat — { id, parentId?, ...yours } — so the array from your API is usually already the right shape.
If you like this library, please consider giving it a star on GitHub or sponsoring the project.